In this article, we will implement drill down for ASP.NET 4.0 built in chart control. On the first chart the data is grouped by year. The year is divided into quarters. By clicking on an item on the chart you can get the values corresponding to the quarters of the selected year. Each quarter consists of 3 months. After choosing a quarter for the selected year you can get the values for each month of the this quarter.
Environment: VS2012,.NET Framework 4.0, ASP.NET Web Form, C#, Entity Framework
Output:

Chart Control:
When you drag Chart control from Toolbox, Visual Studio adds some settings to the web.config
1. At the node <appSettings>, the following entry will be created:
<add key="ChartImageHandler" value="storage=file;timeout=20;dir=c:\TempImageFiles\;" />
2. At <system.web><httpHandlers>,
<add path="ChartImg.axd" verb="GET,HEAD,POST" type="System.Web.UI.DataVisualization.Charting.ChartHttpHandler, System.Web.DataVisualization, Version=4.0.0.0, Culture=neutral, PublicKeyToken=31bf3856ad364e35" validate="false" />
3. In the node <system.web><pages><controls>,
<add tagPrefix="asp" namespace="System.Web.UI.DataVisualization.Charting" assembly="System.Web.DataVisualization, Version=4.0.0.0, Culture:neutral, PublicKeyToken=31bf3856ad364e35" />
4. at <system.web><compilation><assemblies>:
<add assembly="System.Web.DataVisualization, Version=4.0.0.0, Culture=neutral, PublicKeyToken=31BF3856AD364E35"/>
If the above code is missing, you have to add manually.
On the page, the chart code looks like:
    <asp:Chart ID="Chart1" runat="server" OnClick="Chart1_Click" Width="600" Height="400">
            <Series>
                <asp:Series Name="Series1"></asp:Series>
            </Series>
            <ChartAreas>
                <asp:ChartArea Name="ChartArea1"></asp:ChartArea>
            </ChartAreas>
        </asp:Chart>
I defined width, height and click event of chart control.
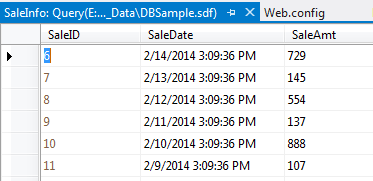
Database Table:
I am using following table for data in sql server compact edition database.
Add "ADO.NET Entity Data Model" in the project and select the above table.
Yearly Chart:
To group data by year and bind to chart control:
  void BindYearChart()
    {
        ChartArea chArea = Chart1.ChartAreas[0];
        DataPointCollection dpc = Chart1.Series[0].Points;
        chArea.AxisX.Title = "Year";
        chArea.AxisY.Title = "Sale Amt";
        chArea.AxisY.LabelStyle.Format = "##,###";
        using (DBSampleEntities context = new DBSampleEntities())
        {

            var data = (from item in context.SaleInfoes
                        group item by item.SaleDate.Value.Year into g
                        select new { Year = g.Key, SaleAmt = g.Sum(x => x.SaleAmt) });

            foreach (var item in data)
            {
                dpc.AddXY(item.Year, item.SaleAmt);
            }
        }

        Series series = Chart1.Series[0];
        series.IsValueShownAsLabel = true;
        series.PostBackValue = "#VALX";
        series.LabelFormat = "##,###";
        series.LabelBackColor = Color.White;
        ViewState["ChartMode"] = "Year";
    }
In above code, we are defining X value of datapoint as PostBackValue.
series.PostBackValue = "#VALX";
On chart click, we will use this value.
If you want to pass another value, you can use any keyword from following table:
| Keyword | Replaced By | Supports Multiple Y Values | Supports Formatting String |
| #VALX | X value of the data point. | No | Yes |
| #VALY | Y value of the data point | Yes | Yes |
| #SERIESNAME | Series name | No | No |
| #LABEL | Data point label | No | No |
| #AXISLABEL | Data point axis label | No | No |
| #INDEX | Data point index in the series | No | Yes |
| #PERCENT | Percent of the data point Y value | Yes | Yes |
| #LEGENDTEXT | Series or data point legend text | No | No |
| #CUSTOMPROPERTY(XXX) | Series or data point XXX custom property value, where XXX is the name of the custom property. | No | No |
| #TOTAL | Total of all Y values in the series | Yes | Yes |
| #AVG | Average of all Y values in the series | Yes | Yes |
| #MIN | Minimum of all Y values in the series | Yes | Yes |
| #MAX | Maximum of all Y values in the series | Yes | Yes |
| #FIRST | Y value of the first point in the series | Yes | Yes |
| #LAST | Y value of the last point in the series | Yes | Yes |
To display yearly chart by default:
 protected void Page_Load(object sender, EventArgs e)
    {
        if (!IsPostBack)
        {
            BindYearChart();
        }
    }
Quarterly Chart:
  void BindQuarterChart(int year)
    {

        Dictionary<int, int> data = new Dictionary<int, int>();

        //Set X axis data
        for (int i = 1; i <= 4; i++)
        {
            data.Add(i, 0);
        }

        ChartArea chArea = Chart1.ChartAreas[0];
        DataPointCollection dpc = Chart1.Series[0].Points;
        chArea.AxisX.Title = "Quarter";
        chArea.AxisY.Title = "Sale Amt";
        chArea.AxisY.LabelStyle.Format = "##,###";

        using (DBSampleEntities context = new DBSampleEntities())
        {

            var amts = (from item in context.SaleInfoes
                        where item.SaleDate.Value.Year == year
                        group item by ((item.SaleDate.Value.Month - 1) / 3) + 1 into g
                        select new { Quarter = g.Key, SaleAmt = g.Sum(x => x.SaleAmt) });

            //Set Y axis values
            foreach (var item in amts)
            {
                data[item.Quarter] = Convert.ToInt32(item.SaleAmt);

            }

            //Add points in chart
            foreach (int str in data.Keys)
            {
                dpc.AddXY("Q" + str, data[str]);
            }


        }
        Series series = Chart1.Series[0];
        series.IsValueShownAsLabel = true;
        series.PostBackValue = "#VALX";
        series.LabelFormat = "##,###";
        series.LabelBackColor = Color.White;
        ViewState["ChartMode"] = "Quarter";
    }
Dictionary object is used to display all points even when there is no data for particular quarter in database.
Monthly Chart:
   void BindMonthChart(int quarter, int year)
    {
        Dictionary<int, int> data = new Dictionary<int, int>();
        //Set X axis data
        for (int i = 1; i <= 3; i++)
        {
            data.Add((quarter-1) * 3 + i, 0);
        }
        ChartArea chArea = Chart1.ChartAreas[0];
        DataPointCollection dpc = Chart1.Series[0].Points;
        chArea.AxisX.Title = "Month";
        chArea.AxisY.Title = "Sale Amt";
        chArea.AxisY.LabelStyle.Format = "##,###";
        using (DBSampleEntities context = new DBSampleEntities())
        {

            var amts = (from item in context.SaleInfoes
                        where ((item.SaleDate.Value.Month - 1) / 3) + 1 == quarter && item.SaleDate.Value.Year == year
                        group item by item.SaleDate.Value.Month into g
                        select new { Month = g.Key, SaleAmt = g.Sum(x => x.SaleAmt) });
            //Set Y axis values
            foreach (var item in amts)
            {
                data[item.Month] =Convert.ToInt32(item.SaleAmt);
            }

            //Add points in chart
            foreach (int str in data.Keys)
            {
                dpc.AddXY( DateTimeFormatInfo.CurrentInfo.GetAbbreviatedMonthName(str), data[str]);
            }
        }
        Series series = Chart1.Series[0];
        series.IsValueShownAsLabel = true;
        series.LabelFormat = "##,###";
        series.LabelBackColor = Color.White;
        ViewState["ChartMode"] = "Month";
    }
and on chart click event, call the above methods:
  protected void Chart1_Click(object sender, ImageMapEventArgs e)
    {
        switch (ViewState["ChartMode"].ToString())
        {
            case "Year":
                int year = Convert.ToInt32(e.PostBackValue);
                BindQuarterChart(year);
                ViewState["SelectedYear"] = year;
                break;
            case "Quarter":
                BindMonthChart(Convert.ToInt32(e.PostBackValue.ToString().Replace("Q", "")), Convert.ToInt32( ViewState["SelectedYear"]));
                break;
            default:
                break;
        }
    }
We have implemented a sample drill down functionality (year - quarter - month) for asp.net chart control. Enjoy Charting !!