This article explains how to display interactive charts with Flot jQuery plugin and ASP.NET Web API. Flot is an open source Javascript plotting library produces graphical plots of arbitrary datasets on-the-fly client-side. We'll get data from database using ASP.NET Web API and use it to display chart.
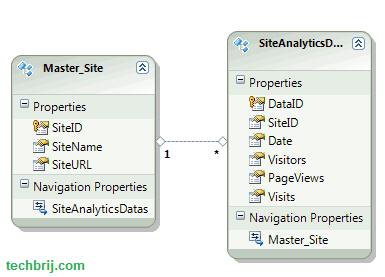
In SQL Server database, 'Analytics' table has date wise visits, page-views information for the site. We'll display monthly summary report using following steps:
Web API:
1. Create ASP.NET MVC 4 Web API project, add new "ADO.NET Entity Data Model" in Model folder and select 'Analytics' and related tables from database.
2. Create a new Empty API Controller say ChartController and Create an action as follows:
 public dynamic Get(int year)
 {
   using (AnalyticsEntities context = new AnalyticsEntities())
            {

                var alldata = (from item in context.SiteAnalyticsDatas
                               where item.Date.Value.Year == year && item.SiteID == 1
                               group item by item.Date.Value.Month into grp
                               select new
                               {
                                   Month = grp.Key,
                                   Visitors = grp.Sum(x => x.Visitors).Value,
                                   Visits = grp.Sum(x => x.Visits).Value,
                                   PageViews = grp.Sum(x => x.PageViews).Value
                               }).ToList();
It takes year and returns month wise total visits,visitors and page-views data. But we'll format the data according to required format of Flot library.
				var ret = new[]
                {
                    new { label="PageViews", data = alldata.Select(x=>new int[]{ x.Month, x.PageViews })},
                    new { label="Visits", data = alldata.Select(x=>new int[]{ x.Month, x.Visits })},
                    new { label="Visitors", data = alldata.Select(x=>new int[]{ x.Month, x.Visitors })}

                };

                return ret;
            }
        }
It will generate JSON as follows:
[
{
"label":"PageViews",
"data":[[1,1605084],
        [2,1810388],
		[3,1774972],
		[4,1800778],
		[5,1917004]
		....
	   ]
},
{
"label":"Visits",
"data":[[1,1074408],
        [2,1317860],
		[3,1299752],
		....
		]
},
....
]
View:
3. For simplicity, we are taking same app to consume web api, create new action in Home controller, add view without layout.
4. Download Flot, Add new flot folder in Scripts and Add flashcanvas folder and jquery.flot.min.js, excanvas.min.js files from the downloaded folder,
include Flot's Javascript files in the page, Make sure jquery is already included before float js file.
    <!--[if lte IE 8]><script language="javascript" type="text/javascript" src="~/Scripts/flot/excanvas.min.js"></script><![endif]-->
    <script language="javascript" type="text/javascript" src="~/Scripts/flot/jquery.flot.min.js"></script>
HTML Structure:
We have a div as placeholder of chart as follows:
<section style="width: 500px; margin: 10px; text-align:center;">
<div id="placeholder" style="width: 500px; height: 300px;">
</div>
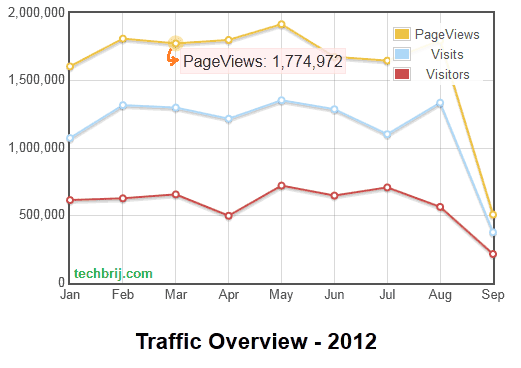
<h3 style="font-size:1.4em">Traffic Overview - 2012 </h3>
</section>
5. Now, we are going to call Web-API action to get data and plot chart as follows:
       var dataurl = 'api/Chart/';
            // setup plot
            var options = {
                legend: {
                    show: true,
                    margin: 10,
                    backgroundOpacity: 0.9
                },
                points: {
                    show: true,
                    radius: 3
                },
                lines: {
                    show: true
                },
                grid: { hoverable: true, clickable: true },
                yaxis: { min: 0,tickFormatter:formatter },
                xaxis: { ticks: [[1,"Jan"],[2,"Feb"],[3,"Mar"],[4,"Apr"],[5,"May"],[6,"Jun"],[7,"Jul"],[8,"Aug"],[9,"Sep"],[10,"Oct"],[11,"Nov"],[12,"Dec"]]}

            };
            function formatter(val, axis) {
                return val.toString().replace(/\B(?=(\d{3})+(?!\d))/g, ",");
            }
            $.ajax({
                url: dataurl,
                method: 'GET',
                data: { year: 2012 },
                dataType: 'json',
                success: function (data) {
                    $.plot($("#placeholder"), data, options);
                }
            });
As we are getting month in int, so to convert it to name, ticks: [[1,"Jan"],[2,"Feb"],....is defined. Alternatively, Use flot time plugin and define mode:"time" in xaxis settings(example).
Tooltip:
To implement tooltip, bind the plothover event and show a div as tooltip dynamically as following:
     var previousPoint = null;
           $("#placeholder").bind("plothover", function (event, pos, item) {
              if (item) {
                if (previousPoint != item.dataIndex) {
                    previousPoint = item.dataIndex;

                    $("#tooltip").remove();
                    var x = item.datapoint[0],
                        y = item.datapoint[1].toString().replace(/\B(?=(\d{3})+(?!\d))/g, ",");
                    showTooltip(item.pageX, item.pageY, item.series.label + ": " + y);

                }
                }
            else {
                $("#tooltip").remove();
                previousPoint = null;
           }
            });


           function showTooltip(x, y, contents) {
        $('<div id="tooltip">' + contents + '</div>').css( {
            position: 'absolute',
            display: 'none',
            top: y + 5,
            left: x + 5,
            border: '1px solid #fdd',
            padding: '2px',
            'background-color': '#fee',
            opacity: 0.80
        }).appendTo("body").fadeIn(200);
    }
Output:
Now, You might want to provide functionality to allow user to select month, quarter or year range and display the chart accordingly, check following post to implement date range picker:
jQuery Date Range Picker To Select Year, Month Or Quarter Only
Hope, It helps.