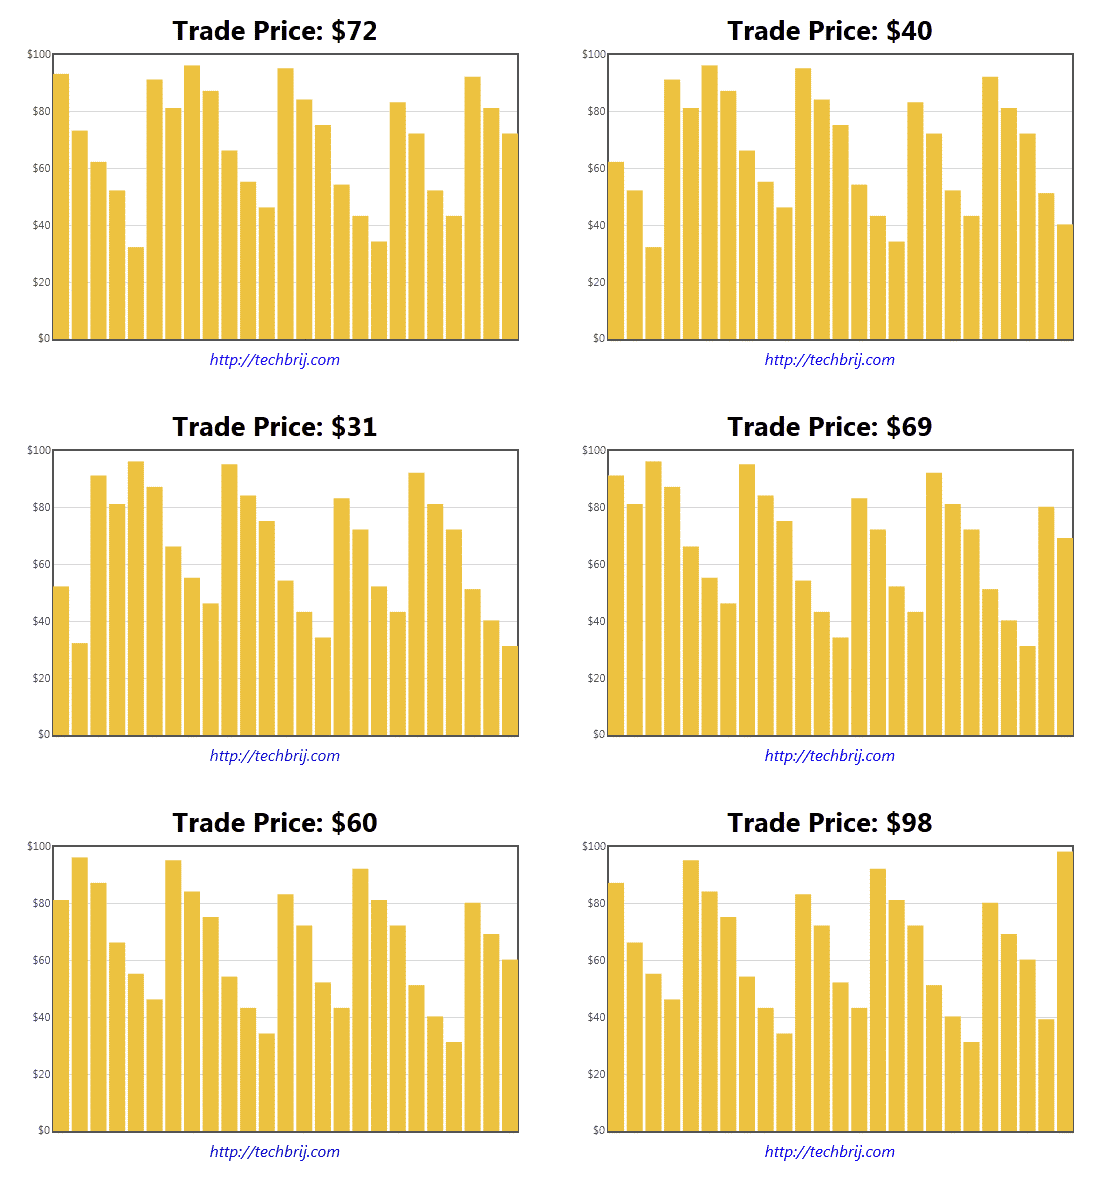
In my recent post, we have implemented Real-Time Chart using HTML5 Push Notification (SSE) and ASP.NET Web API. I got many requests to implement it using SignalR. So In this tutorial, we are going to display real-time updates with SignalR and ASP.NET MVC. SignalR is an async signaling library for ASP.NET to help build real-time, multi-user interactive web applications. It makes easy to push data from the server to the client.

1. Create ASP.NET MVC 4 Project.
2. To install SignalR, run the following command in the Package Manager Console
install-package signalr
3. Download Flot library and Add Flot library scripts (jquery.flot.min.js, excanvas.min.js) in scripts folder
Hub:
4. Add a new folder "Hubs" in the project and add "ChartDataHub.cs" and "ChartData.cs" classes.
in ChartData.cs:
 public class ChartData
    {
        private readonly static Lazy<ChartData> _instance = new Lazy<ChartData>(() => new ChartData());
        private readonly ConcurrentQueue<int> _points = new ConcurrentQueue<int>();
        private readonly int _updateInterval = 250; //ms
        private Timer _timer;
        private readonly object _updatePointsLock = new object();
        private bool _updatingData = false;
        private readonly Random _updateOrNotRandom = new Random();
        private int _startPoint = 50, _minPoint = 25, _maxPoint = 99;

        private ChartData()
        {

        }

        public static ChartData Instance
        {
            get
            {
                return _instance.Value;
            }
        }


        /// <summary>
        /// To initialize timer and data
        /// </summary>
        /// <returns></returns>
        public IEnumerable<int> initData()
        {
            _points.Enqueue(_startPoint);
            _timer = new Timer(TimerCallBack, null, _updateInterval, _updateInterval);
            return _points.ToArray();
        }

       /// <summary>
       /// Timer callback method
       /// </summary>
       /// <param name="state"></param>
        private void TimerCallBack(object state)
        {
            // This function must be re-entrant as it's running as a timer interval handler
            if (_updatingData)
            {
                return;
            }
            lock (_updatePointsLock)
            {
                if (!_updatingData)
                {
                    _updatingData = true;

                    // Randomly choose whether to udpate this point or not
                    if (_updateOrNotRandom.Next(0, 3) == 1)
                    {
                        BroadcastChartData(UpdateData());
                    }
                    _updatingData = false;
                }
            }
        }

        /// <summary>
        /// To update data (Generate random point in our case)
        /// </summary>
        /// <returns></returns>
        private int UpdateData()
        {
            int point = _startPoint;
            if (_points.TryDequeue(out point))
            {
                // Update the point price by a random factor of the range percent
                var random = new Random();
                var pos = random.NextDouble() > .51;
                var change = random.Next((int)point/2);
                change = pos ? change : -change;
                point += change;
                if (point < _minPoint) {
                    point = _minPoint;
                }
                if (point > _maxPoint) {
                    point = _maxPoint;
                }
                _points.Enqueue(point);
            }
            return point;
        }


        private void BroadcastChartData(int point)
        {
            GetClients().updateData(point);
        }

        private static dynamic GetClients()
        {
            return GlobalHost.ConnectionManager.GetHubContext<ChartDataHub>().Clients;
        }
    }
initData: initialize data and timer
UpdateData: to get the latest data(Generate random point in our case)
BroadcastChartData: to broadcast the point
In previous article, we were changing time-interval of timer in timercallback method to get random data at random time interval. Here we are randomly perform the operation to produce same behavior instead of changing time-interval.
 if (_updateOrNotRandom.Next(0, 3) == 1){
 ...do operation...
}
5. in ChartDataHub.cs:
 [HubName("chartData")]
    public class ChartDataHub : Hub
    {
        private readonly ChartData _pointer;

        public ChartDataHub() : this(ChartData.Instance) { }

        public ChartDataHub(ChartData pointer)
        {
            _pointer = pointer;
        }

        public IEnumerable<int> initData()
        {
            return _pointer.initData();
        }
    }
It's the interface for SignalR. HubName Attribute is the 'client side' name of the 'Hub'.
View:
5. Create new action in Home controller, add view without layout. in the view, add jQuery,SignalR and Flot libraries files:
    @Scripts.Render("~/bundles/jquery")
    <!--[if lte IE 8]><script language="javascript" type="text/javascript" src="~/Scripts/excanvas.min.js"></script><![endif]-->
    <script src="~/Scripts/jquery.flot.min.js" type="text/javascript"></script>
    <script src="~/Scripts/jquery.signalR-0.5.3.min.js" type="text/javascript"></script>
    <script src="/signalr/hubs" type="text/javascript"></script>
Here is the HTML Structure:
<div id="body">
        <div style="text-align: center">
            <h1>
                Trade Price: <span id="priceHolder"></span>
            </h1>
            <div id="placeholder" style="width: 600px; height: 300px; margin: 0 auto">
            </div>
            <a href="https://techbrij.com" style="font-style: italic; font-size: medium">techbrij.com</a>
        </div>
    </div>
To create proxy and start SignalR operations, the following javascript code is used:
         //Create the proxy
        var chartData = $.connection.chartData;

        function init() {
            return chartData.initData();
        }

        chartData.updateData = function (data) {
            update(data);
        }

        // Start the connection
        $.connection.hub.start(
		function () {
			init();
		});
chartData.updateData is called on getting new data. We'll implement it to update chart.
Chart:
 var ypt = [], totalPoints = 30;

        function initData() {
            for (var i = 0; i < totalPoints; ++i)
                ypt.push(0);
            return getPoints();

        }
        function getData(data) {
            if (ypt.length > 0)
                ypt = ypt.slice(1);
            ypt.push(data);
            return getPoints();
        }
        function getPoints() {
            var ret = [];
            for (var i = 0; i < ypt.length; ++i)
                ret.push([i, ypt[i]]);
            return ret;
        }

        // setup plot
        var options = {
            series: { shadowSize: 0, bars: {
                show: true,
                barWidth: 0.75,
                fill: 1
            }
            }, // drawing is faster without shadows
            yaxis: { min: 0, max: 100,
                tickFormatter: function (val, axis) {
                    return '$' + val;
                }
            },
            xaxis: { show: false }
        };

        var plot = $.plot($("#placeholder"), [initData()], options);
        function update(data) {
            $('#priceHolder').text('$' + data);
            plot.setData([getData(data)]);
            plot.draw();
        }
We are using same code as used in previous article to draw chart.
You can download source code from Github.
Hope, you enjoy it. Share your opinion or suggestion how you are displaying real-time updates.