Aug 29, 2015

Pivot a JavaScript Array: Convert a Column to a Row

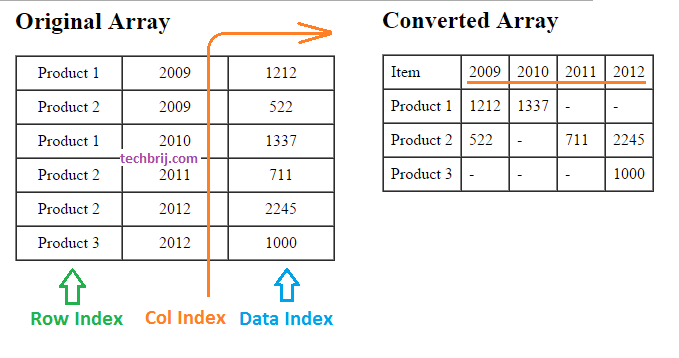
Sometimes we need to convert a column to row in JavaScript array. It might be helpful to pass it as web service argument, generating chart dynamically or to display data in more meaningful way. In this post, we will create a method which converts a specified column to row in JavaScript array like below:


Consider the following array:

var arr = [
//["Product", "Year", "Sales"],
["Product 1", "2009", "1212"],
["Product 2", "2009", "522"],
["Product 1", "2010", "1337"],
["Product 2", "2011", "711"],
["Product 2", "2012", "2245"],
["Product 3", "2012", "1000"]
];

Now add following method to get converted array:

    function getPivotArray(dataArray, rowIndex, colIndex, dataIndex) {
            //Code from https://techbrij.com
			var result = {}, ret = [];
            var newCols = [];
            for (var i = 0; i < dataArray.length; i++) {

                if (!result[dataArray[i][rowIndex]]) {
                    result[dataArray[i][rowIndex]] = {};
                }
                result[dataArray[i][rowIndex]][dataArray[i][colIndex]] = dataArray[i][dataIndex];

                //To get column names
                if (newCols.indexOf(dataArray[i][colIndex]) == -1) {
                    newCols.push(dataArray[i][colIndex]);
                }
            }

            newCols.sort();
            var item = [];

            //Add Header Row
            item.push('Item');
            item.push.apply(item, newCols);
            ret.push(item);

            //Add content 
            for (var key in result) {
                item = [];
                item.push(key);
                for (var i = 0; i < newCols.length; i++) {
                    item.push(result[key][newCols[i]] || "-");
                }
                ret.push(item);
            }
            return ret;
        }

In above method:
dataArray: Array to be converted
rowIndex: Index of column in array which is to be kept as first column
colIndex: Index of column whose values to be converted as columns in the output array.
dataIndex: Index of column whose values to be used as data (displayed in tabular/grid format).

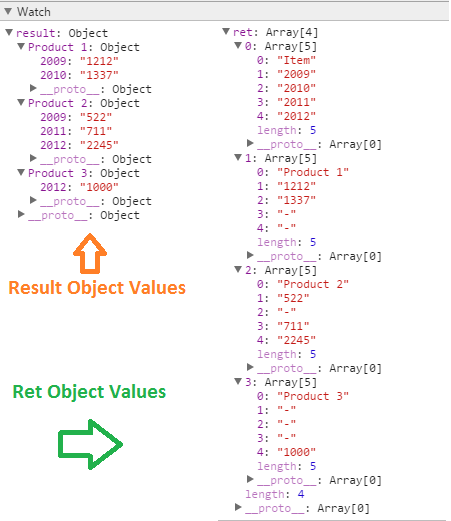
The logic of method is simple. First it iterates the given array and create a result object of [rowIndex],[colIndex] = [dataIndex] format so that it can be fetched easily by using associative array like syntax. In the same iteration, we put unique values of colIndex in newCols array which will be used to create new columns. After this loop, we will get result object and newCols array. Now create a return array (ret), push newCols values for Header data and iterate result object, push values in ret object. Finally, ret variable will have the converted array.

Here is example to use the above method:

   var output = getPivotArray(arr, 0, 1, 2);

To show array in HTML table, add following javascript function:

 function arrayToHTMLTable(myArray) {
            var result = "<table border='1' cellpadding='7' cellspacing='0'>";
            for (var i = 0; i < myArray.length; i++) {
                result += "<tr>";
                for (var j = 0; j < myArray[i].length; j++) {
                    result += "<td>" + myArray[i][j] + "</td>";
                }
                result += "</tr>";
            }
            result += "</table>";

            return result;
        }		

on HTML side, add following

 <h2>Original Array</h2>
    <div id="orgTable"></div>

    <h2>Converted Array</h2>
    <div id="pivotTable"></div>

Here jQuery is used to display table

  $(function () {
            var output = getPivotArray(arr, 0, 1, 2);
            $('#orgTable').html(arrayToHTMLTable(arr));
            $('#pivotTable').html(arrayToHTMLTable(output));
        });

In this post, we have converted one column to row in JavaScript array and display data accordingly.

Hope, It helps.

14 comments

  1. I like this a lot, great work for simple pivoting in vanilla javascript.

    However if the Row Index and Column Index have multiple combinations instead of just one combination each, there seems to be colliding data (for example: if you .push [“Product 1”, “2009”, “9999”] to your original arr Array, then “9999” overwrites the “1212”). So how difficult is it to implement more complex pivoting, where you can provide data aggregations (sum, average, min, max) or text aggregation (LISTAGG/STRING_AGG/GROUP_CONCAT)? Your input of Row, Column and Value Index is very reminiscent of python pandas and how their dataframes take input to pivot a table, and I do a ton of data and text aggregation in pandas.

    Also (as Raed mentioned with Quarter as the 2nd column in his version of the arr Array) how easy is it to implement multiple Indexes of the same type? That is to say, instead of passing in “1” for the Column Index, it sounds like Raed wants to pass in an array [“1”, “2”] to handle his Year and Quarter together?

    Anyways great work, it’s very difficult to find a pivoting solution in vanilla javascript. I am implementing a solution using lodash now and it doesn’t feel very elegant or intuitive, am happy to share it if you are interested. Cheers

    1. Has anybody found a way to pivot the data with average aggregations when data collides instead of overwriting it? This is a great script and has helped me a lot, but I’m struggling with the average aggregations.

      thanks!

  2. Hello Guys,

    Truly appreciate your response…
    So I have data below like this…
    id ,101,102,103
    Name, A1, A2, A3,
    Loc, L1, L2, L3
    :: IN xslx (Excel )file format.
    expected o/p is
    id, name, loc
    101,A1,L1
    102,A2,L2
    103,A3,L2
    Please help me to solve this Problem…

  3. How can I add another column with additiponal categorization of products (to stay with your example).
    As of now any additional column gets stripped off by your function

  4. Hello,
    it’s amazing.
    What about if I need to add quarter under year
    [“Product 1”, “2009”, “Q1”, “235”],
    [“Product 1”, “2009”, “Q2”, “580”],
    [“Product 1”, “2009”, “Q3”, “420”],
    [“Product 1”, “2009”, “Q4”, “600”],
    [“Product 2”, “2010”, “Q1”, “200”],
    [“Product 2”, “2010”, “Q2”, “150”],
    [“Product 3”, “2011”, “Q1”, “150”],
    [“Product 4”, “2011”, “Q1”, “320”],
    [“Product 4”, “2011”, “Q2”, “460”],
    [“Product 4”, “2011”, “Q3”, “500”],

Leave a Reply

Your email address will not be published. Required fields are marked *