The simplest way to draw Google chart is to create simple JavaScript array of data, Convert to dataTable using arrayToDataTable method, pass it in chart.draw method. But what would happen if you have a array of 3 columns and you have to add series dynamically based on a particular column? In this case, you don't know about the number of series, it is based on the values of the column. Let us take following JavaScript array as an example:
 var arr = [
        ["Product 1", "2009", 1212],
        ["Product 2", "2009", 522],
        ["Product 1", "2010", 1337],
        ["Product 2", "2011", 711],
        ["Product 2", "2012", 2245],
        ["Product 3", "2012", 1000]
        ];
Here we will draw product wise chart (data series of years) and year wise chart (data series of products). We will convert columns to rows in JavaScript array. To do this, I strongly recommend to read following post first:
Pivot a JavaScript Array: Convert a Column to a Row
We are going to use getPivotArray method of above post and the logic is well explained in that post.
 function getPivotArray(dataArray, rowIndex, colIndex, dataIndex) {
            var result = {}, ret = [];
            var newCols = [];
            for (var i = 0; i < dataArray.length; i++) {

                if (!result[dataArray[i][rowIndex]]) {
                    result[dataArray[i][rowIndex]] = {};
                }
                result[dataArray[i][rowIndex]][dataArray[i][colIndex]] = dataArray[i][dataIndex];

                //To get column names
                if (newCols.indexOf(dataArray[i][colIndex]) == -1) {
                    newCols.push(dataArray[i][colIndex]);
                }
            }

            newCols.sort();
            var item = [];

            //Add Header Row
            item.push('Performance');
            item.push.apply(item, newCols);
            ret.push(item);

            //Add content
            for (var key in result) {
                item = [];
                item.push(key);
                for (var i = 0; i < newCols.length; i++) {
                    item.push(result[key][newCols[i]] || 0);
                }
                ret.push(item);
            }
            return ret;
        }
I set default value 0 in case of null value. To draw Google chart, add script reference of following:
<script type="text/javascript" src="https://www.google.com/jsapi"></script>
and add following script:
	  google.load("visualization", "1.1", {packages:["bar"]});
      google.setOnLoadCallback(drawChart);
      function drawChart() {
        var productWiseData = google.visualization.arrayToDataTable(getPivotArray(arr, 0, 1, 2));
		var yearWiseData = google.visualization.arrayToDataTable(getPivotArray(arr, 1, 0, 2));

        var chart = new google.charts.Bar(document.getElementById('columnchart_product'));
        chart.draw(productWiseData,{});

		var chart = new google.charts.Bar(document.getElementById('columnchart_year'));
        chart.draw(yearWiseData, {});
      }
In productWiseData, we are converting Year column to rows and In yearWiseData, Product column is converted to rows.
Add following HTML code:
		<div id="columnchart_product" style="width: 600px; height: 300px;"></div>
		<div id="columnchart_year" style="width: 600px; height: 300px;"></div>
Output:
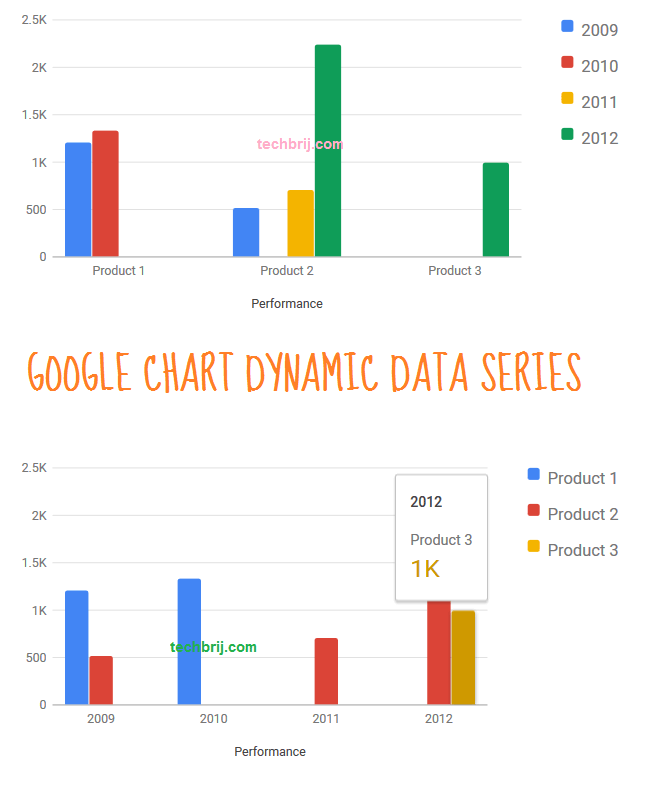
Conclusion:
In this post, we have added data series dynamically in Google Chart from an array column and generate different charts from same data.
Hope it helps. Don't forget to share if you like this post.