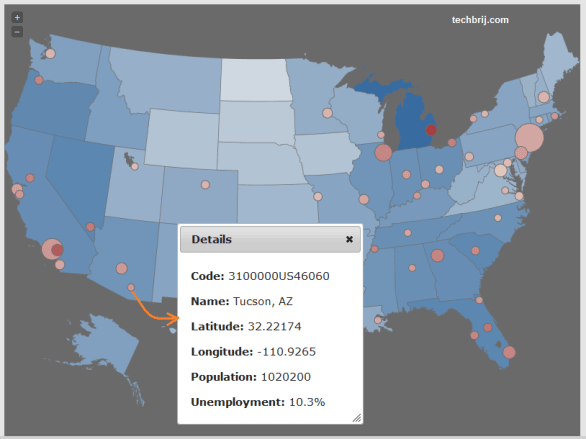
In this tutorial, we will implement to get data from ASP.NET Web API and create map chart with markers using jVectorMap plugin. jQuery UI dialog will be used to display drill-down detail information in a responsive and clean manner. This post is based on jVectorMap Data Visualization tutorial.
Getting Started:
1. Create ASP.NET MVC 4 Internet application.
2. Download jvectormap files.
3. Add "jquery-jvectormap-1.2.2.min.js" in Scripts folder and "jquery-jvectormap-1.2.2.css" files in Content folder.
4. We are going to implement USA map, so download jquery-jvectormap-us-aea-en.js and add in Scripts folder.
Database Structure:
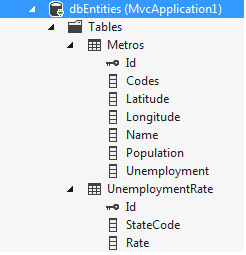
We are going to use same database structure as in previous post and the data is used from GitHub repository.

We use Entity Framework Database first approach. Add "Ado.Net Entity Data Model" in Model folder and select the database and tables.
Web API:
Right Click on Controllers folder > Add > Controller
Enter Name "DataController" > Select Template “API Controller with empty Read/Write Actions"> Add
We implement two methods:
1. To get data to draw chart. This method will return data in the specific format for easy jvectormap integration.
2. To get marker details on a particular marker click.
 public class DataController : ApiController
    {
       private dbEntities db = new dbEntities();

        // GET api/data
        public dynamic Get()
        {
            var ret = new
            {
                states = db.UnemploymentRates.Select(x=> new{ Key = x.StateCode,Value =x.Rate}).ToDictionary(x=>x.Key,x=>x.Value),
                metro =
                    new
                    {
                        codes = db.Metros.Select(x => x.Codes).ToList(),
                        coords = db.Metros.Select(x => new List<decimal> { x.Latitude, x.Longitude }).ToList(),
                        names = db.Metros.Select(x => x.Name).ToList(),
                        population = db.Metros.Select(x => x.Population).ToList(),
                        unemployment = db.Metros.Select(x => x.Unemployment).ToList()
                    }
            };
            return ret;
        }

        // GET api/data/5
        public dynamic Get(int index)
        {
            return db.Metros.ToList().Where((x,i) => i==index).FirstOrDefault();
        }

        protected override void Dispose(bool disposing)
        {
            db.Dispose();
            base.Dispose(disposing);
        }
    }
View:
Add a view without layout and reference jvectormap css.
    @Styles.Render("~/Content/css")
    @Styles.Render("~/Content/themes/base/css")
    @Scripts.Render("~/bundles/modernizr")
    <link href="~/Content/jquery-jvectormap-1.2.2.css" rel="stylesheet" />
Add div for map:
<section class="featured">
        <div class="map" style="width: 800px; height: 600px;margin:0 auto"></div>
</section>
Add script references:
    @Scripts.Render("~/bundles/jquery")
    @Scripts.Render("~/bundles/jqueryui")
    <script src="~/Scripts/jquery-jvectormap-1.2.2.min.js"></script>
    <script src="~/Scripts/jquery-jvectormap-us-aea-en.js"></script>
You can create a bundle for jvectormap and add the bundle also.
Now, next step is to use jQuery ajax to get data.
 var data = {};
            $.ajax({ url: 'api/data', type: 'GET', async: false, dataType: 'json' }).done(function (result) {
                data = result;
            })
To load map with markers:
 var statesValues = Array.prototype.concat.apply([], jvm.values(data.states)),
            metroPopValues = Array.prototype.concat.apply([], jvm.values(data.metro.population)),
            metroUnemplValues = Array.prototype.concat.apply([], jvm.values(data.metro.unemployment));

            $('.map').vectorMap({
                map: 'us_aea_en',
                markers: data.metro.coords,
                series: {
                    markers: [{
                        attribute: 'fill',
                        scale: ['#FEE5D9', '#A50F15'],
                        values: data.metro.unemployment,
                        min: jvm.min(metroUnemplValues),
                        max: jvm.max(metroUnemplValues)
                    }, {
                        attribute: 'r',
                        scale: [5, 20],
                        values: data.metro.population,
                        min: jvm.min(metroPopValues),
                        max: jvm.max(metroPopValues)
                    }],
                    regions: [{
                        scale: ['#DEEBF7', '#08519C'],
                        attribute: 'fill',
                        values: data.states,
                        min: jvm.min(statesValues),
                        max: jvm.max(statesValues)
                    }]
                },
                onMarkerLabelShow: function (event, label, index) {
                    label.html(
                      '<b>' + data.metro.names[index] + '</b><br/>' +
                      'Population: ' + data.metro.population[index] + '<br/>' +
                      'Unemployment rate: ' + data.metro.unemployment[index] + '%'
                    );
                },
                onRegionLabelShow: function (event, label, code) {
                    label.html(
                      '<b>' + label.html() + '</b><br/>' +
                      'Unemployment rate: ' + data.states[code] + '%'
                    );
                },
                onRegionClick: function (element, code, region) {
                    var message = ' Code: '
                        + code.toUpperCase();
                    alert(message);
                }


            });
            var mapObject = $('.map').vectorMap('get', 'mapObject');
To display jQuery UI dialog on marker click, add following after onRegionClick
onMarkerClick: function (e, code) {
                    //To create a sample for ajax call
                    $.ajax({ url: 'api/data', type: 'GET', async: false, dataType: 'json', data: { 'index': code } })
                        .done(function (result) {
                            var dialogDiv = $('<div id="MenuDialog">\
                                              <p><b>Code:</b> '+ result.Codes + '  </p>\
											<p><b>Name:</b> ' + result.Name + '  </p>\
											<p><b>Latitude:</b> ' + result.Latitude + '  </p>\
											<p><b>Longitude:</b> ' + result.Longitude + '  </p>\
											<p><b>Population:</b> ' + result.Population + '  </p>\
											<p><b>Unemployment:</b> ' + result.Unemployment + '%  </p>\
											</div>');
                            dialogDiv.dialog({
                                modal: true,
                                title: "Details",
                                show: 'clip',
                                hide: 'clip'
                            });


                        })
                    .fail(function () { alert('problem to load data'); });
                }
On marker click, ajax request is made to get data related to marker and jquery ui dialog is displayed with data.
Output:

Conclusion:
We have implemented a sample visualization of unemployment statistics in the USA by states and metropolitan areas. It displays tooltip on mouse over of region and marker. Also, displays metropolitan details on marker click. You can download source code from GitHub. If you have any query, put it in comment box and don't forget to share this post if you like it.