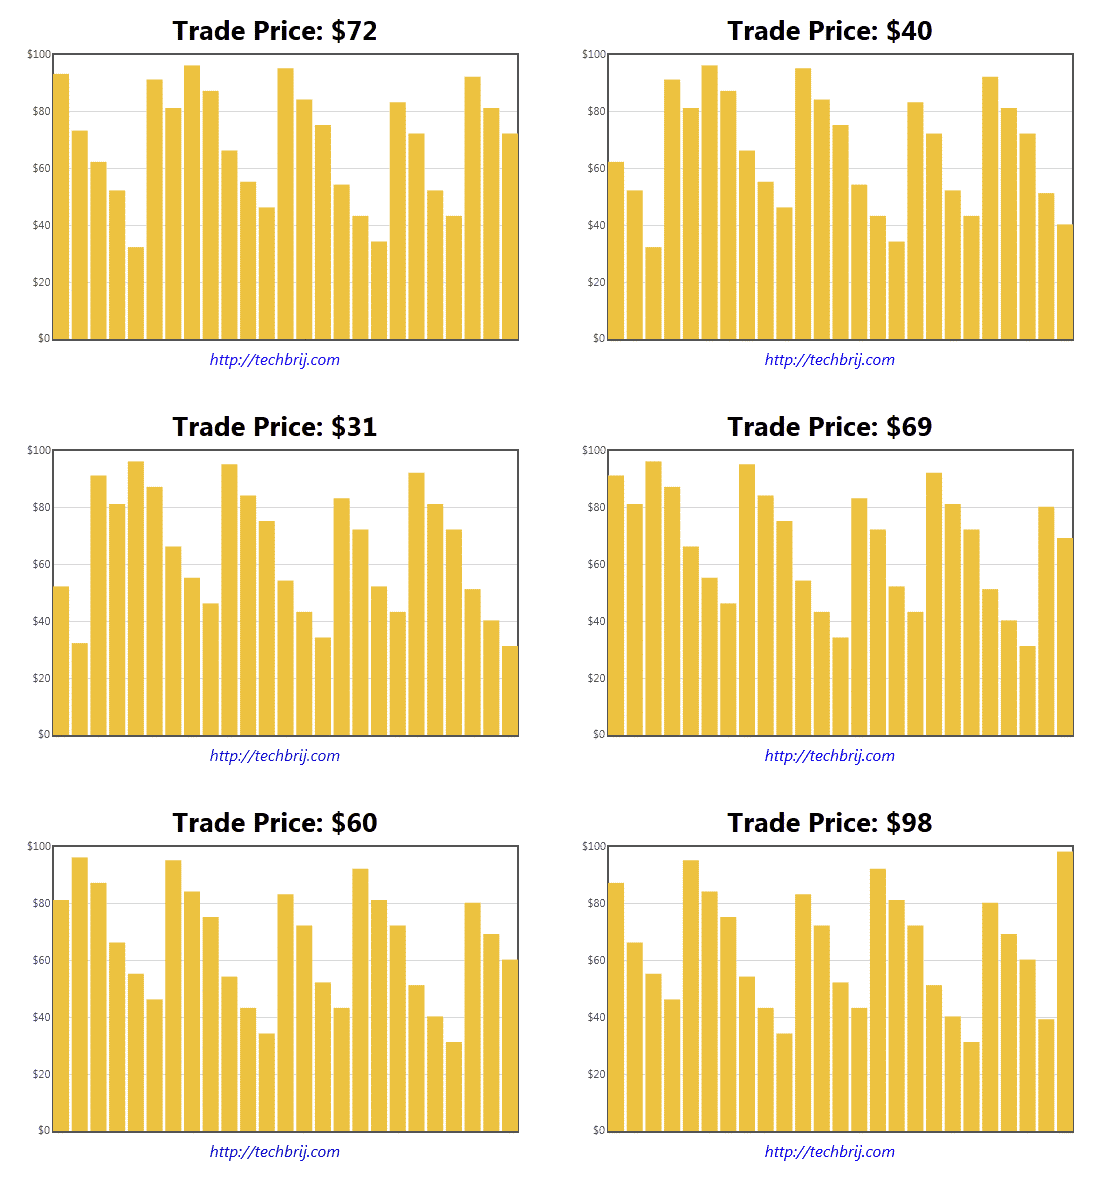
In my recent post, we have seen how to create basic chart using jQuery Flot and ASP.NET Web API. In this article, we'll create a chart to display real-time updates using native HTML5 push notification. The HTML5 Server-Sent event (SSE) model allows you to push real-time data updates from the server to the browser.

Generally, we are using Ajax methods to get new data at specified intervals. So, each time client has to call the server even there is no new data. It's not efficient. With HTML5 Server-Sent requests, we can stream data from the server, with updates pushed from there without the code at client side having to keep requesting it and we can process new data in javascript code when it receives from the server.
Web API:
Here, our objective is to get random number at random time interval from server and plot the chart. We are going to start with Henrik F Nielsen's post to develop an application utilizing a real HTTP push messaging infrastructure. We are defining content-type : text/event-stream and data in following format for SSE:
data: Hello World!\n\nThere is no length limit for the text and empty line fires the event. We will generate random number instead of "Hello World" text to draw chart.
 public class ChartController : ApiController
    {
        private static readonly Lazy<Timer> _timer = new Lazy<Timer>(() => new Timer(TimerCallback, null, 0, 1000));
        private static readonly ConcurrentQueue<StreamWriter> _streammessage = new ConcurrentQueue<StreamWriter>();

        public HttpResponseMessage Get(HttpRequestMessage request)
        {
            Timer t = _timer.Value;
            HttpResponseMessage response = request.CreateResponse();
            response.Content = new PushStreamContent(OnStreamAvailable, "text/event-stream");
            return response;
        }
        private static void TimerCallback(object state)
        {
            Random randNum = new Random();
            foreach (var data in _streammessage)
            {

                data.WriteLine("data:" + randNum.Next(30, 100) + "\n");
                data.Flush();

            }
            //To set timer with random interval
            _timer.Value.Change(TimeSpan.FromMilliseconds(randNum.Next(1,3)*500), TimeSpan.FromMilliseconds(-1));

        }
        public static void OnStreamAvailable(Stream stream, HttpContentHeaders headers, TransportContext context)
        {
            StreamWriter streamwriter = new StreamWriter(stream);
            _streammessage.Enqueue(streamwriter);
        }
    }
Here we are changing timer interval randomly to create more real environment.
View:
For simplicity, we are taking same app to consume web api, create new action in Home controller, add view without layout.
Download Flot and add jquery.flot.min.js, excanvas.min.js files from the downloaded folder, Make sure jquery is already included before float js file.
<!--[if lte IE 8]><script language="javascript" type="text/javascript" src="~/Scripts/excanvas.min.js"></script><![endif]-->
<script language="javascript" type="text/javascript" src="~/Scripts/jquery.flot.min.js"></script>
HTML:
	<div style="text-align: center">
        <h1>
            Trade Price: <span id="priceHolder"></span>
        </h1>
        <div id="placeholder" style="width: 600px; height: 300px; margin: 0 auto">
        </div>
    </div>
placeholder is used for chart and priceHolder is to display current price.
EventSource API:
To start receiving server notifications, we simply open a connection to an SSE URI and setup our callbacks in javascript:
 if (!!window.EventSource) {
                var source = new EventSource('http://localhost:49999/api/chart/');
                source.addEventListener('message', function (e) {
                    console.log(e.data);
                    update(parseInt(e.data, 10));
                }, false);

                source.addEventListener('open', function (e) {
                    console.log("open!");
                }, false);

                source.addEventListener('error', function (e) {
                    if (e.readyState == EventSource.CLOSED) {
                        console.log("error!");
                    }
                }, false);

            } else {
                // not supported!
            }
Chart:
When we get new number from server side, the first number is removed, new number is pushed, the points are re-indexed and assigned to Flot chart.
            var ypt = [], totalPoints = 30;

            function initData() {
                for (var i = 0; i < totalPoints; ++i)
                    ypt.push(0);
                return getPoints();

            }
            function getData(data) {
                if (ypt.length > 0)
                    ypt = ypt.slice(1);
                ypt.push(data);
                return getPoints();
            }
            function getPoints() {
                var ret = [];
                for (var i = 0; i < ypt.length; ++i)
                    ret.push([i, ypt[i]]);
                return ret;
            }

            // setup plot
            var options = {
                series: { shadowSize: 0, bars: {
                    show: true,
                    barWidth: 0.75,
                    fill: 1
                }
                }, // drawing is faster without shadows
                yaxis: { min: 0, max: 100,
                    tickFormatter: function (val, axis) {
                        return '$' + val;
                    }
                },
                xaxis: { show: false }
            };

            var plot = $.plot($("#placeholder"), [initData()], options);
            function update(data) {
                $('#priceHolder').text('$' + data);
                plot.setData([getData(data)]);
                plot.draw();
            }
You can download source code from Github.
Hope, you enjoy it. Share your opinion or suggestion how you are displaying real-time updates.
Reference:
Recent ASP.NET Web API Updates – April 24
Native HTML5 push notifications with ASP.NET Web API and Knockout.js