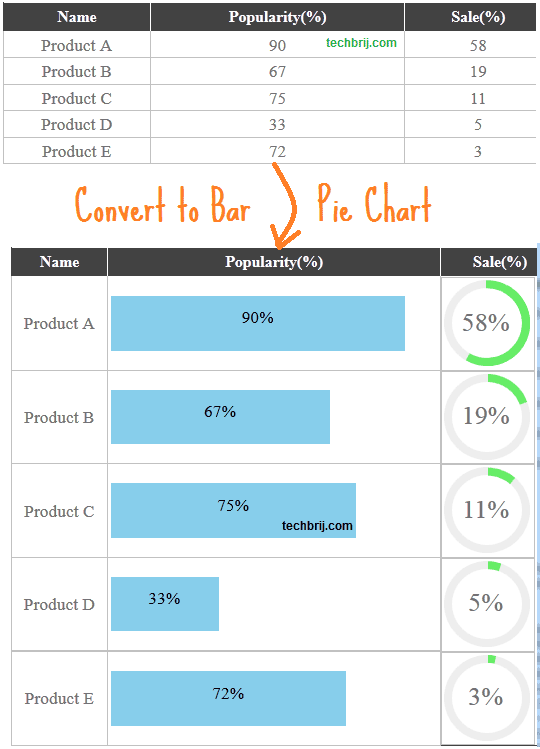
Suppose you've to display survey result in grid having different columns with percentage data. It would be more effective and attractive if you use chart to show percentage data. This post explains how to display Bar or Pie chart in HTML table or ASP.NET gridview column with CSS3 and jQuery.
HTML Table Structure:
<table class="mGrid" cellspacing="0" cellpadding="3" rules="all" border="1" id="GridView1" style="border-collapse:collapse;">
		<tr>
			<th scope="col">Name</th><th scope="col">Popularity(%)</th><th scope="col" style="width:100px;">Sale(%)</th>
		</tr><tr>
			<td>Product A</td><td class="barChart">90</td><td class="pieChart">58</td>
		</tr><tr>
			<td>Product B</td><td class="barChart">67</td><td class="pieChart">19</td>
		</tr><tr>
			<td>Product C</td><td class="barChart">75</td><td class="pieChart">11</td>
		</tr><tr>
			<td>Product D</td><td class="barChart">33</td><td class="pieChart">5</td>
		</tr><tr>
			<td>Product E</td><td class="barChart">72</td><td class="pieChart">3</td>
		</tr>
	</table>
Here barChart CSS class is used on second column for bar chart and pieChart CSS class is used on third column for pie chart.
If you are using asp.net GridView, You can apply same classes.
<asp:GridView ID="GridView1" runat="server" ClientIDMode="Static"  AutoGenerateColumns="False" CssClass="mGrid" CellSpacing="0" CellPadding="3">
        <Columns>
            <asp:BoundField DataField="Name" HeaderText="Name" />
            <asp:BoundField DataField="Popularity" HeaderText="Popularity(%)" ItemStyle-CssClass="barChart" />
            <asp:BoundField DataField="Sale" HeaderText="Sale(%)" ItemStyle-CssClass="pieChart" HeaderStyle-Width="100px"  />
        </Columns>
 </asp:GridView>
To bind ASP.NET GridView:
 Product[] products = {
new Product { Name="Product A", Sale=58, Popularity = 90   },
new Product { Name="Product B", Sale=19, Popularity = 67  },
new Product { Name="Product C", Sale=11, Popularity = 75  },
new Product { Name="Product D", Sale=5 , Popularity = 33 },
new Product { Name="Product E", Sale=3 , Popularity = 72 }
};

        GridView1.DataSource = products;
        GridView1.DataBind();
Bar Chart:
        .barChart
        {
            width: 300px;
        }
        .barChart div.bar
        {
            background-color: #87CEEB;
            text-align: center;
            height:40px;
           padding-top:10px;
           color:Black;
           border-radius:0px 5px 5px 0px;
        }
The logic is to set width of div according to data.
$('#GridView1 .barChart').each(function (index, value) {
            $(this).html('<div class="bar" style="width:' + $(this).text() + '%">' + $(this).text() +'%</div>');
        });
Pie Chart:
 .pieChart
        {
            position: relative;
            font-size: 80px;
            width: 1em;
            height: 1em;
            display: block;
        }
        .percent
        {
            position: absolute;
            top: 1.05em;
            left: 0;
            width: 3.33em;
            font-size: 0.3em;
            text-align: center;
        }

        .slice
        {
            position: absolute;
            width: 1em;
            height: 1em;
            clip: rect(0px,1em,1em,0.5em);
        }
        .slice.gt50
        {
            clip: rect(auto, auto, auto, auto);
        }
        .slice > .pie
        {
            border: 0.1em solid #66EE66;
            position: absolute;
            width: 0.8em; /* 1 - (2 * border width) */
            height: 0.8em; /* 1 - (2 * border width) */
            clip: rect(0em,0.5em,1em,0em);
            -moz-border-radius: 0.5em;
            -webkit-border-radius: 0.5em;
            border-radius: 0.5em;
        }
        .pieBack
        {
            border: 0.1em solid #EEEEEE;
            position: absolute;
            width: 0.8em;
            height: 0.8em;
            -moz-border-radius: 0.5em;
            -webkit-border-radius: 0.5em;
            border-radius: 0.5em;
        }
        .slice > .pie.fill
        {
            -moz-transform: rotate(180deg) !important;
            -webkit-transform: rotate(180deg) !important;
            -o-transform: rotate(180deg) !important;
            transform: rotate(180deg) !important;
        }
We'll implement following structure to draw Pie chart with above CSS:
<td class="pieChart">
<div class="percent">58%</div>
<div class="pieBack"></div>
<div class="slice gt50">
<div style="-moz-transform: rotate(208.8deg);" class="pie"></div>
<div style="-moz-transform: rotate(208.8deg);" class="pie fill"></div>
</div>
</td>
Now the logic is to change -prefix-transform property according to data to rotate.
$('#GridView1 .pieChart').each(function (index, value) {
            var percent = $(this).text();
            var deg = 360 / 100 * percent;
            $(this).html('<div class="percent">' + Math.round(percent) + '%' + '</div><div class="pieBack"></div><div ' + (percent > 50 ? ' class="slice gt50"' : 'class="slice"') + '><div class="pie"></div>' + (percent > 50 ? '<div class="pie fill"></div>' : '') + '</div>');
            $(this).find('.slice .pie').css({
                '-moz-transform': 'rotate(' + deg + 'deg)',
                '-webkit-transform': 'rotate(' + deg + 'deg)',
                '-o-transform': 'rotate(' + deg + 'deg)',
                'transform': 'rotate(' + deg + 'deg)'
            });
        });
Hope, It helps.